My projects
Table of Contents
- Search Engine for Indigenous Rights Archives (with IPRI & CorrelAid)
- Modeling information diffusion in empirical and theoretical social networks
- Stock value prediction based on sentiment analysis of financial articles
- Measuring political involvement in Twitter using SVM and followers network
- Link between political involvement and polarization in social media
- Interactive map of drug consumption in the European Union
- Evaluating Spotify's song valence metric
- Dimensionality and reliability of an original questionnaire
- Visualizing restaurant ratings
Here you can find some of the projects I have been involved in the past. Only projects not protected under NDA are shown, thus most come from my studies. Too long? Click on ☰ for an overview.
Search Engine for Indigenous Rights Archives (with IPRI & CorrelAid)
OpenSearch Docker Python Flask NLP
CorrelAid is a non-profit network of data scientists dedicated to supporting NGOs and public initiatives working for social good. One of their projects involved a collaboration with Indigenous Peoples Rights International (IPRI), an NGO focused on monitoring violations of Indigenous peoples’ rights. As part of this effort, IPRI maintains an extensive archive of reports on these topics, dating back to the 1990s. The size of this collection made it necessary to develop a search engine that allows members and other stakeholders to quickly find documents based on criteria such as date, location, topic, and publishing authority. Working alongside a team of data scientists and developers, I contributed to the design, development, and deployment of this solution.
Modeling information diffusion in empirical and theoretical social networks
network analysis hypothesis testing information diffusion modeling
The correspondence between the Barabási-Albert (BA) model and empirical social networks has long been accepted for metrics such as degree distribution or clustering coefficient. Nevertheless, to our knowledge the validity of this network model has not been tested in the context of information diffusion (i.e. the spread of ideas among interacting social agents). In the present work we compare different information spread metrics (e.g. reach, speed, characteristic of influential nodes) between the BA model and an empirical Facebook social network, assuming information spread via different models. The correspondence will be evaluated by means of different error measurements and significance tests. Checks the project's Github.
Stock value prediction based on sentiment analysis of financial articles
NLP time series APIs financial modeling
The project attempted to answer the research question: does the prediction of stock value improve when using information about sentiment on financial articles referring to the stock? The research involved three phases. First, a sentiment analysis was performed on a dataset of articles involving different companies. A dictionary-based and pre-trained machine learning algorithms were tested, and the former proved more efficient and accurate. The quality of the measure was tested by performing bootstrap significance testing on the difference between the measured sentiment and the 'actual' manually annotated one, for a random sample of 20 articles. Although most differences were significant, a correlation showed a high value and a high bootstrap significance. Secondly, a vector autoregression model (VAR) was fitted to the data. This involved linking two time series for each company: daily stock data and daily sentiment data. After fixing the stationarity of the stock data, the fit of the model was evaluated using traditional measures such as RMSE, AIC and significance of coefficients. The third step involved a more sophisticated evaluation of the goodness of fit. We fitted a second model that only involved historical stock data: a autoregressive model (AR). We performed equivalent steps and used identical data, simply in a univariate test. Finally, we used both trained models to predict 14 days ahead (from the end of the data set), and computed the RMSE and its bootstrap confidence interval. We concluded that for none of the companies introducing information about sentiment in corresponding financial articles improved the prediction of stock value. Code is available in the following GitHub page.
Measuring political involvement in Twitter using SVM and followers network
SVM classifier NLP API model fitting measurement validity
The results from my bachelor thesis did not correspond to expectations (see below). Reflecting on possible reasons behind it, the measurement of political attitudes seemed to be a good candidate for further improvement. A careful application of a dictionary-based Sentiment Analysis coupled with Name Entity Recognition, seemed to have fail at capturing users' political attitude. Specifically, it seemed to average out extreme opinions of single users. The improvement involved separating the measurement of the opinion's polarity from the measurement of its strength. The former was assessed using a pre-trained Support Vector Machine classifying posts as pro or against the political ideology, based on their network of Twitter followers and followings. The latter measurement involved sentiment analysis in absolute terms (i.e. 0 = weak opinion; 5 = very strong opinion). The same analysis as in the bachelor thesis was performed using this new metric. Results show that the new measurement solved the problem the previous method showed, and political attitudes distributions were indeed showing bimodality. Nevertheless, no increase in the extremity of this bimodality as a function of political involvement was observed. The full report contains more information about the rationale behind the decision and the methods used.
Link between political involvement and polarization in social media
attitude modeling NLP model fitting API
This was my Bachelor's Thesis project entitled: Using Social Media Analytics to Explore Political Involvement and Polarization: Challenges and New Insight. It go awarded a 9. Here is the abstract: /"When applied to political attitudes, the Cusp Catastrophe model predicts that people with a high political involvement will hold extreme political attitudes (i.e. will be more polarized). We tested this prediction by fitting a Cusp Catastrophe model to data regarding political involvement and attitude towards Joe Biden, obtained using Twitter Analytics and Natural Language Processing. Political involvement was measured using a dictionary approach: how many of a user's last 100 posts contained ‘political terms' and thus could be considered political. Attitude towards Joe Biden was measured by performing a Sentiment Analysis on those posts in which the user mentioned only Joe Biden and no other political/social figure (this filtering was accomplished using Name Entity Recognition). The Cusp Catastrophe model showed a poor fit to this data, pointing at political involvement being unrelated to extremity of political attitudes." To see data sets, code and full report visit this GitHub repository.
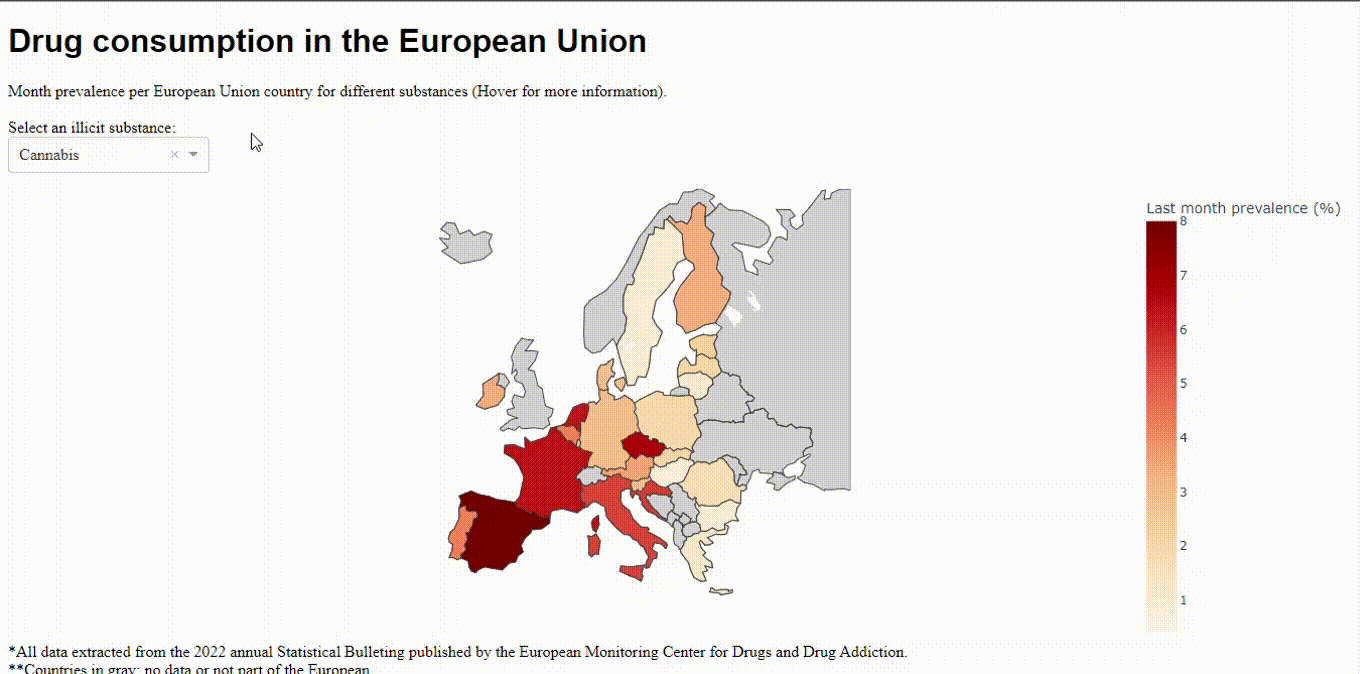
Interactive map of drug consumption in the European Union
data visualization
I crated an interactive choropleth map of the European Union where one can quickly see what was the last month prevalence for different drugs (e.g. cannabis, alcohol, cocaine, tobacco). Data comes from the European Monitoring Centre for Drugs and Drug Addiction's (EMCDD) 2022 Statistical Bulletin. The visualization was crated using Plotly and Plotly Dash. Some extra features include sample size information and survey year. This appears one hovers over a country. To see the code, documentation and the accompanying report visit this GitHub repository. To see a quick preview click here.
Evaluating Spotify's song valence metric
data analysis data collection API
This study evaluates the correspondence between songs' objective valence judgement (i.e. Spotify's valence metric) and subjective happiness ratings (i.e. measured using a questionnaire). Additionally, many studies have shown that musical sophistication has an effect on the relationship between objective and subjective musical perception (Castro & Lima, 2014). We will examine whether the level of expertise in music will impact musical perception in the context of valence, leading to the following research question: To what extent does objective valence judgement predict subjective happiness ratings and to what extent is this relationship moderated by music sophistication? I was in charge of the data cleaning and analysis process, as well as the data visualization. I tested the main hypothesis of both valence metrics being related applying a Simple Linear Regression. I evaluated wether music sophistication altered this relationship using a Moderation Analysis. We also wanted to test whether participants with a higher musical sophistication 'agreed more' on the valence judgement of songs. I tested this using Levene's test on each song.
All these tests, the rationale behind them, testing of assumptions, and visualization and interpretation of results can be seen in the following website.
Dimensionality and reliability of an original questionnaire
data analysis data collection
This project involved following a very common method of questionnaire construction and validation in Psychology. We attempted to create a measurement of a person's general mistrust tendency. This effort was grounded in previous literature, which lead to the segmentation of the questionnaire in different 'dimensions' for different aspects of mistrust. Thus, a way of evaluating the questionnaire was to perform a confirmatory factor analysis (i.e. similar to PCA) and test if items linked to a same dimension of mistrust clustered together.
Visualizing restaurant ratings
data visualization
The clarity and aesthetics of visualizations are rarely valued in scientific education. Thus I spend some free time improving this aspects of my visualization skills. This summer my family and I (i.e. the Chulvi family) decided to do a small gastronomic around our hometown (i.e. Valencia, Spain). We evaluated restaurants based on different criteria which, in turn, had different weights. By the end of the tour, having gathered this data, I decided to create a small visualization. The goal was, not only to be able to tell what restaurant, but to also see what criteria each restaurant excelled/failed at. This would also allow the reader to make an informed decision, in case he was most interested in one criteria (e.g. food quality) than another (e.g. service quality). The resulting visualization can be seen here.